Get QuickLook Preview of Swift objects in XCode
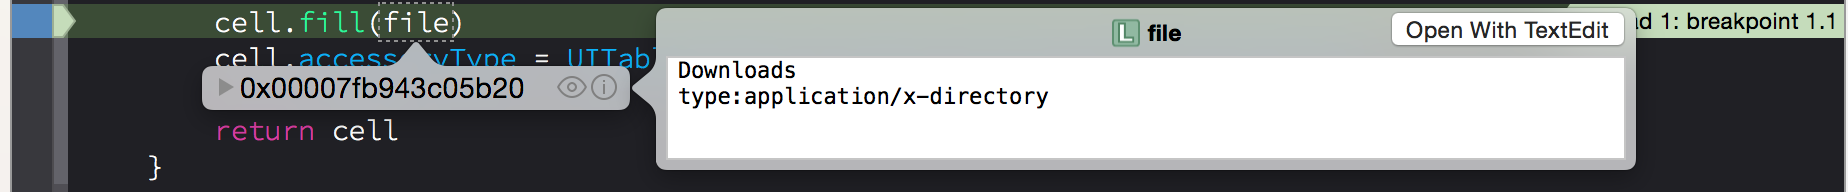
When setting breakpoints in XCode, it’s quite hard to see what exactly is inside an object. All XCode give you is memory address of that object. In XCode 6 it’s possible to overcome this by implementing debugQuickLookObject method in your object. This function will be called when program is stopped by a breakpoint and you hover over the object and select the little eye icon.
For example, in my File class, I’ve implemented this method in my class. As you can see the output is very useful and handy for debugging. It works great for NSManagedObjects too!
class File: NSManagedObject {
    @NSManaged var id: NSNumber
    @NSManaged var parent_id: NSNumber
    @NSManaged var name: String!
    @NSManaged var content_type: String!

    func init(json:NSDictionary){ /* ... */
    }

    func debugQuickLookObject() -> AnyObject? {
        return "\(name)\ntype:\(content_type)"
    }
}
debugQuickLookObject can return almost anything. From a string to image to sounds. It should return one of the cases of QuickLookObject which is listed here:
enum QuickLookObject {
    case Text(String)
    case Int(Int64)
    case UInt(UInt64)
    case Float(Double)
    case Image(Any)
    case Sound(Any)
    case Color(Any)
    case BezierPath(Any)
    case AttributedString(Any)
    case Rectangle(Double, Double, Double, Double)
    case Point(Double, Double)
    case Size(Double, Double)
    case Logical(Bool)
    case Range(UInt64, UInt64)
    case View(Any)
    case Sprite(Any)
    case URL(String)
}